The Mortgage Corner2013 Home Prices Soar
Housing prices are soaring, with both the S&P Case-Shiller Home Price Index 3-month average (for November, December and January) and FHFA conforming loan indexes accelerating. Mortgage delinquencies also continue to decline, which should help depleted inventories.
In January 2013, nine cities -- Atlanta, Charlotte, Las Vegas, Los Angeles, Miami, New York, Phoenix, San Francisco and Tampa -- and both Composites posted positive monthly returns. Dallas was the only Metro Area where the level remained flat.The S&P/Case-Shiller Home Price Indices showed average home prices increased 7.3 percent for the 10-City Composite and 8.1 percent for the 20-City Composite in the 12 months ending in January 2013.“The two headline composites posted their highest year-over-year increases since summer 2006,” says David M. Blitzer, Chairman of the Index Committee at S&P Dow Jones Indices. “This marks the highest increase since the housing bubble burst."
Graph: Calculated Risk
The FHFA price index for January increased 0.6 percent, following a rise of 0.5 percent the prior month. The January gain was led by the Pacific region, increasing 1.6 cent. The weakest region was New England, down 0.7 percent for the month. But the index is up 6.5 percent year-over-year.
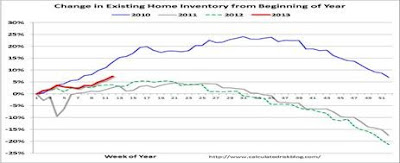
More good news was the continuing decline in mortgage delinquencies, according to LPS lenders’s services, as reported by Calculated Risk. LPS reported the U.S. mortgage delinquency rate (loans 30 or more days past due, but not in foreclosure) decreased to 6.80 percent from 7.03 percent in January. The percent of loans in the foreclosure process declined to 3.38 percent in February in January.Both numbers are still high, with 4.25 percent being the long term delinquency rate and 1 to 2 percent the historical foreclosure rate. This decline is already showing up in increasing for sale inventories, with Calculated Risk also reporting that through March 25th - inventory is increasing faster than in 2011 and 2012. But Housing Tracker reports inventory is down -21.2 percent compared to the same week in 2012—still a rapid year-over-year decline (2013 is red line in graph).
Graph: Calculated Risk
What does all this mean? As delinquency/foreclosure rates continue to decline, inventory should continue to increase, which means more housing sales. Although new-home sales declined slightly in February, sales are still 12.3 percent higher than February 2012.And February existing home sales rose 0.8 percent to an annualized pace of 4.98 million units. January was revised to up 0.8 percent from the initial estimate of 0.4 percent. Low supply had been holding down sales but that appears to be changing as higher prices are bringing more homes into the market. Supply jumped 9.6 percent to 1.94 million units. Months’ supply rose to 4.7 months from 4.3 months in January.Harlan Green © 2013


No comments:
Post a Comment