Showing posts with label mortgage delinquencies. Show all posts

Tuesday, July 16, 2013

Mortgage Delinquencies Continue to Decline


The Mortgage Corner
Mortgage Delinquencies Continue Decline

Mortgage delinquencies and foreclosures continue to decline.  According to Lender Processing Services (LPS), 6.08 percent of mortgages were delinquent in May, down from 6.21 percent in April, while 3.05 percent of mortgages were in the foreclosure process, down from 4.12 percent in May 2012.
This was the largest drop in delinquencies in 11 years, and gives a total of 9.13 percent delinquent or in foreclosure. It breaks down as:

• 1,708,000 properties that are 30 or more days, and less than 90 days past due, but not in foreclosure.
• 1,335,000 properties that are 90 or more days delinquent, but not in foreclosure.
• 1,525,000 loans in foreclosure process.

                                                               Graph: Calculated Risk

Delinquencies are down more than 15 percent since the end of December 2012, coming in at 6.08 percent for the month. As LPS Applied Analytics Senior Vice President Herb Blecher explained, much of this improvement is supported by the fact that new problem loan are approaching the pre-crisis average.
“Though they are still approximately 1.4 times what they were, on average, during the 1995 to 2005 period, delinquencies have come down significantly from their January 2010 peak,” Blecher said. “In large part, this is due to the continuing decline in new problem loans -- as fewer problem loans are coming into the system, the existing inventories are working their way through the pipeline. New problem loan rates are now at just 0.73 percent, which is right about on par with the annual averages during 2005 preceding.
It has to be why consumer spending is in effect soaring.  Consumers were out in force in May as consumer credit rose a huge $19.6 billion. Revolving credit jumped $6.6 billion for the largest gain since May last year and the second largest of the recovery. The gain points to a jump in credit card use which, if extended, would be a big plus for retailers.  It hasn’t increased at all for most of the year, until now.


Non-revolving credit also jumped in the month, up $13.0 billion for yet another outsized gain that reflects both strong car sales but also gains in the student loan component that are tied in part to ongoing government acquisitions of student loans from private lenders, acquisitions that do not necessary reflect current student borrowing.
                So the wealth effect from more jobs and rising housing prices seems to be taking hold.  That is why delinquencies have been declining, in the main.  This is while the Labor Department’s Job Openings and Labor Turnover Survey (JOLTS) showing some 3.828 million new job openings in June, and 4.4 million new jobs created.


Both hires and separations are oscillating upward with hires running a little higher than separations. In May, there were 4.441 million hires versus 4.395 million the month before. There were 4.323 million total separations in the month of May-slightly up from 4.287 million in April.  The separations rate was 3.2 percent. Total separations include quits, layoffs and discharges, and other separations.

Harlan Green © 2013


Friday, March 29, 2013

2013 Home Prices Soar


The Mortgage Corner
 
2013 Home Prices Soar

Housing prices are soaring, with both the S&P Case-Shiller Home Price Index 3-month average (for November, December and January) and FHFA conforming loan indexes accelerating. Mortgage delinquencies also continue to decline, which should help depleted inventories.
The S&P/Case-Shiller Home Price Indices showed average home prices increased 7.3 percent for the 10-City Composite and 8.1 percent for the 20-City Composite in the 12 months ending in January 2013.
“The two headline composites posted their highest year-over-year increases since summer 2006,” says David M. Blitzer, Chairman of the Index Committee at S&P Dow Jones Indices. “This marks the highest increase since the housing bubble burst."
In January 2013, nine cities -- Atlanta, Charlotte, Las Vegas, Los Angeles, Miami, New York, Phoenix, San Francisco and Tampa -- and both Composites posted positive monthly returns. Dallas was the only Metro Area where the level remained flat. 


Graph: Calculated Risk 
The FHFA price index for January increased 0.6 percent, following a rise of 0.5 percent the prior month.  The January gain was led by the Pacific region, increasing 1.6 cent.  The weakest region was New England, down 0.7 percent for the month. But the index is up 6.5 percent year-over-year.
 

More good news was the continuing decline in mortgage delinquencies, according to LPS lenders’s services, as reported by Calculated Risk. LPS reported the U.S. mortgage delinquency rate (loans 30 or more days past due, but not in foreclosure) decreased to 6.80 percent from 7.03 percent in January. The percent of loans in the foreclosure process declined to 3.38 percent in February in January. 
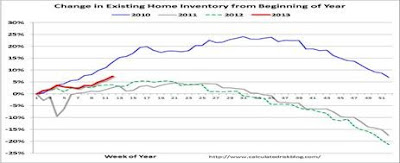
Both numbers are still high, with 4.25 percent being the long term delinquency rate and 1 to 2 percent the historical foreclosure rate. This decline is already showing up in increasing for sale inventories, with Calculated Risk also reporting that through March 25th - inventory is increasing faster than in 2011 and 2012. But Housing Tracker reports inventory is down -21.2 percent compared to the same week in 2012—still a rapid year-over-year decline (2013 is red line in graph).

Graph: Calculated Risk 
What does all this mean? As delinquency/foreclosure rates continue to decline, inventory should continue to increase, which means more housing sales. Although new-home sales declined slightly in February, sales are still 12.3 percent higher than February 2012.
And February existing home sales rose 0.8 percent to an annualized pace of 4.98 million units.  January was revised to up 0.8 percent from the initial estimate of 0.4 percent. Low supply had been holding down sales but that appears to be changing as higher prices are bringing more homes into the market.  Supply jumped 9.6 percent to 1.94 million units.  Months’ supply rose to 4.7 months from 4.3 months in January.
 
Harlan Green © 2013


Friday, November 30, 2012

FHA Announces Revised Loss Mitigation Home Retention Options


WASHINGTON –The Federal Housing Administration (FHA) announced changes on Friday to its loss mitigation program which are intended to allow more borrowers to take advantage of opportunities that enable them to keep their homes.   Through revisions made to FHA’s Loss Mitigation Home Retention Options, a greater number of distressed borrowers will be able to qualify for FHA loss mitigation interventions, and the level of assistance available to them will be larger than under previous guidelines.  These changes will not only assist families in keeping their homes, but will also reduce the number of full claims against the FHA Mutual Mortgage Insurance Fund.
“FHA’s Loss Mitigation Program has long been an industry leader in helping to ensure that distressed borrowers are afforded maximum opportunities to retain their homes,” said Acting FHA Commissioner Carol Galante.  “Not only are we taking steps to make sure more borrowers can benefit from FHA loss mitigation assistance, but we are also targeting our assistance to provide more sustainable payments for borrowers so that they are successful in retaining their homes over the long term.  At the same time, these efforts will reduce losses to FHA from foreclosures, benefiting our insurance fund.”
Included among the changes being announced to FHA’s existing Loss Mitigation options are the following:
  • Streamlining FHA’s Loss Mitigation Home Retention Option priority order to a new 3-tier incentive structure, consisting of Special Forbearance, Loan Modification, and FHA-HAMP;
    • Special Forbearance is a written agreement between a lender and borrower to reduce and/or suspend mortgage payments.
    • Loan Modification is a permanent change to one or more of the terms of a mortgage loan.
    • FHA-HAMP typically involves the combination of a Loan Modification and a Partial Claim where the lender will advance funds on behalf of the borrower in an amount necessary to reinstate the delinquent loan.
  • Redefining “Special Forbearance” to apply only in cases where the mortgagors are unemployed;
  • Eliminating some requirements which limited lenders’ ability to provide the assistance borrowers needed;
  • And expanding the FHA-HAMP program so that greater numbers of borrowers find sustainable long term assistance through FHA-HAMP modifications.
The entire list of changes can be found in FHA’s Mortgagee Letter 2012 – 22.
FHA lender/servicers have no longer than 90 days after issuance of this Mortgagee Letter to begin assessing delinquent borrowers under these new guidelines.

Wednesday, November 7, 2012

Shadow Housing Inventory, Foreclosure Fall


The Mortgage Corner
Shadow Housing Inventory, Foreclosures Fall
 
CoreLogic reported the current residential shadow inventory as of July 2012 fell to 2.3 million units, representing a supply of six months. This was a 10.2 percent drop from July 2011, when shadow inventory stood at 2.6 million units, which is approximately the same level the country was experiencing in March 2009. Currently, the flow of new seriously delinquent (90 days or more) loans into the shadow inventory has been roughly offset by the equal volume of distressed (short and real estatehttp://images.intellitxt.com/ast/adTypes/icon1.png owned) sales.
“The decline in shadow inventory has recently moderated reflecting the lower outflow of distressed sales over the past year,” said Mark Fleming, chief economist for CoreLogic. “While a lower outflow of distressed sales helps alleviate downward home price pressure, long foreclosure timelines in some parts of the country causes these pools of shadow inventory to remain in limbo for an extended period of time.”
Data Highlights as of July 2012:
  • As of July 2012, shadow inventory fell to 2.3 million units or six-months’ supply and represented just over three-fourths of the 2.7 million properties currently seriously delinquent, in foreclosure or in REO.
  • Of the 2.3 million properties currently in the shadow inventory, 1 million units are seriously delinquent (2.9 months’ supply), 900,000 are in some stage of foreclosure (2.5-months’ supply) and 345,000 are already in REO (1.0-months’ supply).
  • The dollar volume of shadow inventory was $382 billion as of July 2012, down from $397 billion a year ago and $385 billion last month.
  • Serious delinquencies, which are the main driver of the shadow inventory, declined the most from April 2012 to July 2012 in Arizona (3.2 percent), Pennsylvania (2.8 percent), New Jersey (2.3 percent), Delaware (2.2 percent) and Maine (2.2 percent).
  • As of July 2012, Florida, California, Illinois, New York and New Jersey make up 45 percent of all distressed properties in the country.
CoreLogic also released its latest National Foreclosure Report which provides monthly data on completed foreclosures, foreclosure inventory and 90+ delinquency rates.
  • The five states with the highest number of completed foreclosures for the 12 months ending in August 2012 were: California (110,000), Florida (92,000), Michigan (62,000), Texas (58,000) and Georgia (55,000). These five states account for 48.1 percent of all completed foreclosures nationally.
  • The five states with the lowest number of completed foreclosures for the 12 months ending in August 2012 were: South Dakota (25), District of Columbia (113), Hawaii (435), North Dakota (564) and Maine (612).
  • The five states with the highest foreclosure inventory as a percentage of all mortgaged homes were: Florida (11.0 percent), New Jersey (6.5 percent), New York (5.2 percent), Illinois (4.8 percent) and Nevada (4.6 percent).
  • The five states with the lowest foreclosure inventory as a percentage of all mortgaged homes were: Wyoming (0.5 percent), Alaska (0.8 percent), North Dakota (0.8 percent), Nebraska (0.9 percent) and South Dakota (1.1 percent).
                Corelogic said that home prices nationwide, including distressed sales, increased on a year-over-year basis by 4.6 percent in August 2012 compared to August 2011. This change represents the biggest year-over-year increase since July 2006. On a month-over-month basis, including distressed sales, home prices increased by 0.3 percent in August 2012 compared to July 2012.
                So we see the Federal Reserve’s commitment to keep interest rates at historic lows for as long as it takes to revive the housing market, and bring down the unemployment rate to more acceptable levels, is already showing results.
 
Harlan Green © 2012

Thursday, December 15, 2011

2012 Mortgage delinquencies seen dropping sharply

By EILEEN AJ CONNELLY, AP Personal Finance Writer

(12-07) 07:05 PST New York (AP) --

If the U.S. economy does not suffer more setbacks, the rate of mortgage holders behind on their payments should decline significantly by the end of next year, according to credit reporting agency TransUnion.
Mortgage delinquency rates — the ratio of borrowers 60 or more days behind on their payments — will likely tick up to about 6 percent through the first three months of 2012, TransUnion said in its annual delinquency forecast issued Wednesday.

But by the end of next year, it could drop to 5 percent, TransUnion said. 

That's well off the peak of 6.89 percent seen in the fourth quarter of 2009.
Chicago-based TransUnion's forecast takes into consideration several factors, including expectations that consumer confidence and the economy will improve next year.

Also, banks are expected to get a good portion of pending foreclosures off their books next year, said Charlie Wise, TransUnion director of research and consulting.

Banks are still working through a backlog of foreclosures created by issues including the robo-signing scandal, in which bank officials signed mortgage documents without verifying the information they contained. The issue surfaced last year in areas with large numbers of foreclosures, and banks had to backtrack and review foreclosures across the country to make sure their paperwork was in order.

That slowed down the process, Wise said, and left mortgages listed as delinquent for longer than they otherwise might have been, temporarily boosting delinquency rates.

Economic uncertainty has also contributed. In the third quarter of 2011, mortgage delinquencies saw their first uptick in six quarters, largely fueled by concerns over the economy as lawmakers were debating the U.S. debt ceiling and Europe's debt crisis was unfolding.

Helping to cut the mortgage delinquency rate are a slowly improving job market and a stabilizing housing market.

While the drop will be significant, the rate will remain well above the pre-recession average of 1.5 to 2 percent. "We have a long way to go to get back," said Steven Chaouki, a TransUnion vice president.

The situation with credit cards is much stronger. Card delinquencies — payments late by 90 days or more — dropped to their lowest levels in 17 years during the spring, then saw a slight increase in the third quarter, but still remained near historic lows.


Read more: http://www.sfgate.com/cgi-bin/article.cgi?f=/n/a/2011/12/06/national/a210622S66.DTL#ixzz1gdJoL1WP